The 34-Point Gap
Part two of three on Gallup’s 2026 education findings. Part one covers what Americans say schools are actually bad at.
Two answers from the same people
Ask an American parent how satisfied they are with K-12 education in the United States and 32% say satisfied. Ask the same parent how satisfied they are with the education their own child is getting and 66% say satisfied.
Same people. Same survey. Thirty-four points apart.
Gallup does not treat this as an anomaly. Its own summary of the 2026 findings puts it plainly:
“The persistent gap between parents’ ratings of their own child’s education and of U.S. education overall suggests that Americans’ concerns are less about their own child’s school and more about the state of the system nationwide.”
That is the finding underneath the finding, and it is worth more attention than the headline number got.
The gap is not new
It is close to the most durable result in American education polling.
The PDK poll, which has been asking a version of this question since the 1960s, found in June 2025 that 43% of Americans gave the schools in their own community an A or a B, while 13% gave the nation’s public schools an A or a B. A 30-point spread, from a different pollster, a different question and a different scale, in a different month.
Gallup has been finding the same shape since 1984. People rate the schools they can see far higher than the schools they read about. The gap survives changes of administration, changes in test scores, and changes in survey method. It is not noise.
The usual explanation is the obvious one, and it is probably right: familiarity. People judge their local school on a building, a teacher, a kid coming home in the afternoon. They judge “the nation’s schools” on whatever they last heard about the nation’s schools.
Jack Schneider of UMass Amherst put the arithmetic of it to the Associated Press: when people weigh in on the nation’s schools, “what they are commenting on are 98,999 schools that they haven’t set foot in.”
What is new is that both ends are falling
For most of the trend, the story was a stable local number and a sagging national one. People lost faith in the system while keeping faith in their school. That is no longer what the data shows.
- PDK’s community-school grades: 43% A or B in 2025, down from 53% in 2013.
- PDK’s national grades: 13% A or B in 2025, down from 26% in 2004.
- Gallup’s parents-on-their-own-child measure: 66% in 2026, down from 83% in 1999.
The ceiling has been coming down for years. What is different now is that the floor is moving too.
That deserves one honest caveat, the same one worth making about any subsample: Gallup’s parent figures rest on 233 parents in the telephone poll, with a margin of error around ±8 points, and the previous low on that measure was 67% in 2013. As a one-year “record” it is inside the noise. As a 27-year slope from 83% to 66%, it is not.
What each number is actually measuring
The two questions look similar and behave completely differently.
The national number is a mood reading. It moved 19 points among Democrats, 10 among independents and 6 among Republicans in two years. No plausible account of school quality explains a partisan spread like that. Gallup’s Zach Hrynowski was direct about it: “People have a general negative vibe about everything in the country right now. People are frustrated, and don’t think any institution is working particularly well.” Gallup’s confidence-in-institutions series shows the same slump nearly everywhere it looks.
The local number is an experience reading — and it has its own bias running the other way. Parents are rating a school they chose, or a town they moved to, or at minimum a place their own child spends the day. Loyalty, sunk cost and simple self-regard all push that number up. Nobody enjoys concluding that their kid’s school is bad.
So one measure is under-informed and the other is invested. Neither should be read on its own.
But they fail in opposite directions, and that makes them useful together. Where an under-informed pessimist and an invested optimist agree, you can believe the answer.
Where the two juries agree
They agree about critical thinking.
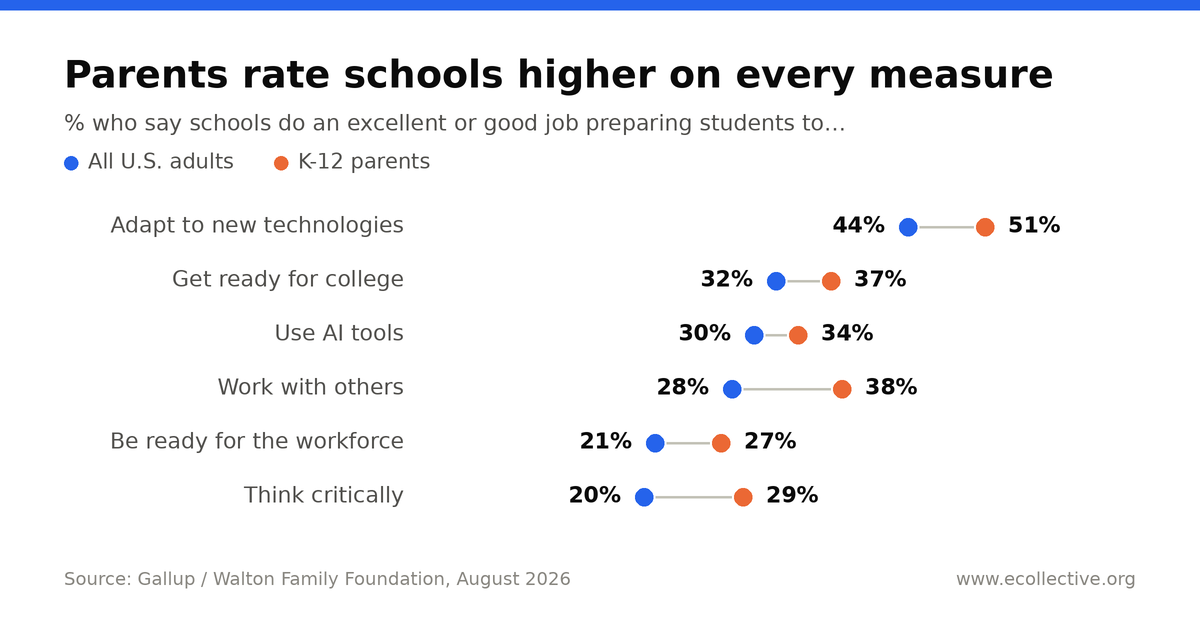
Of everything Gallup asked, the widest parent/non-parent split was on critical thinking and working with others — 13 points each. That is exactly what the loyalty effect predicts: parents defending their own school hardest on the softest, most personal measures.
And yet parents still only rate schools 29% good or excellent at teaching critical thinking. Across all adults it is 20%. The gap is real, and it barely matters, because both numbers are terrible.
The people most inclined to defend their school and the people most inclined to condemn the system reach nearly the same verdict on whether kids are being taught to think. That is the number to take seriously.
The same pattern holds on workforce readiness: 27% among parents, 21% overall. Two juries, different prejudices, same conviction.
Why it matters which number policy listens to
National satisfaction is the number that makes headlines, and headline numbers are what large-scale restructuring gets argued from. A country that believes its education system is failing wholesale will reach for wholesale answers.
But the 66% is where the working parts are. It describes real classrooms, real teachers and real kids, reported by the people closest to them. It is falling, which is a genuine warning. It is also still double the national figure, which is a genuine fact about how much of the system works.
Both things are true, and only one of them tends to make it into the argument.
There is a version of school reform that treats the 32% as the reality and the 66% as sentimentality — that assumes everything must be replaced because nothing is working. The evidence does not support it. As part one sets out, the districts that adopted comprehensive reading reforms are improving, and more than a hundred are now above their pre-pandemic levels in both math and reading. Reform works when it is specific.
The opposite error is just as available: treating the 66% as proof that the complaints are overblown and nothing needs to change. The critical-thinking numbers close that exit. Parents are not saying everything is fine. They are saying their school is fine and their kid is not being taught to think.
The gap is what has held the coalition together
There is a political fact buried in this that is easy to miss.
For forty years, the gap has been the thing that kept American public education stable. A large majority of people who believed the system was failing nevertheless liked their own school, and so kept sending their children to it, kept voting for its levies, and kept turning up to its board meetings. Generalized despair about “the schools” has never translated into abandonment of this school, because the two beliefs were held by the same person about different objects.
That arrangement depends entirely on the local number staying high.
Which is why 66%, and the slide from 83% that produced it, is the number to watch rather than the 32%. National satisfaction has been low for most of the trend without much changing on the ground. Local satisfaction falling is a different kind of event. It is the one that shows up in enrollment figures rather than in polling commentary.
It also cuts both ways in the argument, and both sides are quoting the same poll. Reform advocates point to 32% as proof the system has lost the country. Defenders point to 66% as proof that the complaints belong to people who are not in the building. Both citations are accurate. Neither is the finding.
What we take from it
Design for the 66%.
That is the practical conclusion. The useful question is not “how do we replace a failed system” — most parents, looking at the only school they can actually see, do not report a failed system. The useful question is what is specifically, consistently missing, which both juries have now answered: the ability to think through a claim, and the ability to show what you can actually do.
That is why the Six E’s are framed as things a learner needs rather than things an institution provides. Evidence — check the claim — is a habit, and it can be built inside a school or outside one. Expertise — prove what you know, and the proof is in the work — is the piece the credential was supposed to carry and increasingly does not.
Open Degree exists for that second half: clear outcomes, evidence-based assessments and verifiable micro-credentials you truly own, built so that skills and credentials travel rather than depending on which of the 98,999 schools a kid happened to attend. It does not require anyone to leave anything. It is infrastructure that works regardless of which building you are sitting in — which is the right shape for a problem that shows up in schools people are otherwise satisfied with.
Part three, Dissatisfaction Is Turning Into Departure, looks at the families who are leaving anyway, and what the alternatives owe them.
If you are building toward the same thing, get in touch.